Overall online spend has increased significantly over 2020 and especially over the April and May Alert levels. As a result, most sectors are now enjoying higher levels of spend but a couple of sectors find themselves with spend numbers below where they were 12 months ago.
Let’s look at each of the sectors and what’s driving their performance so far in 2020 (Jan – July).

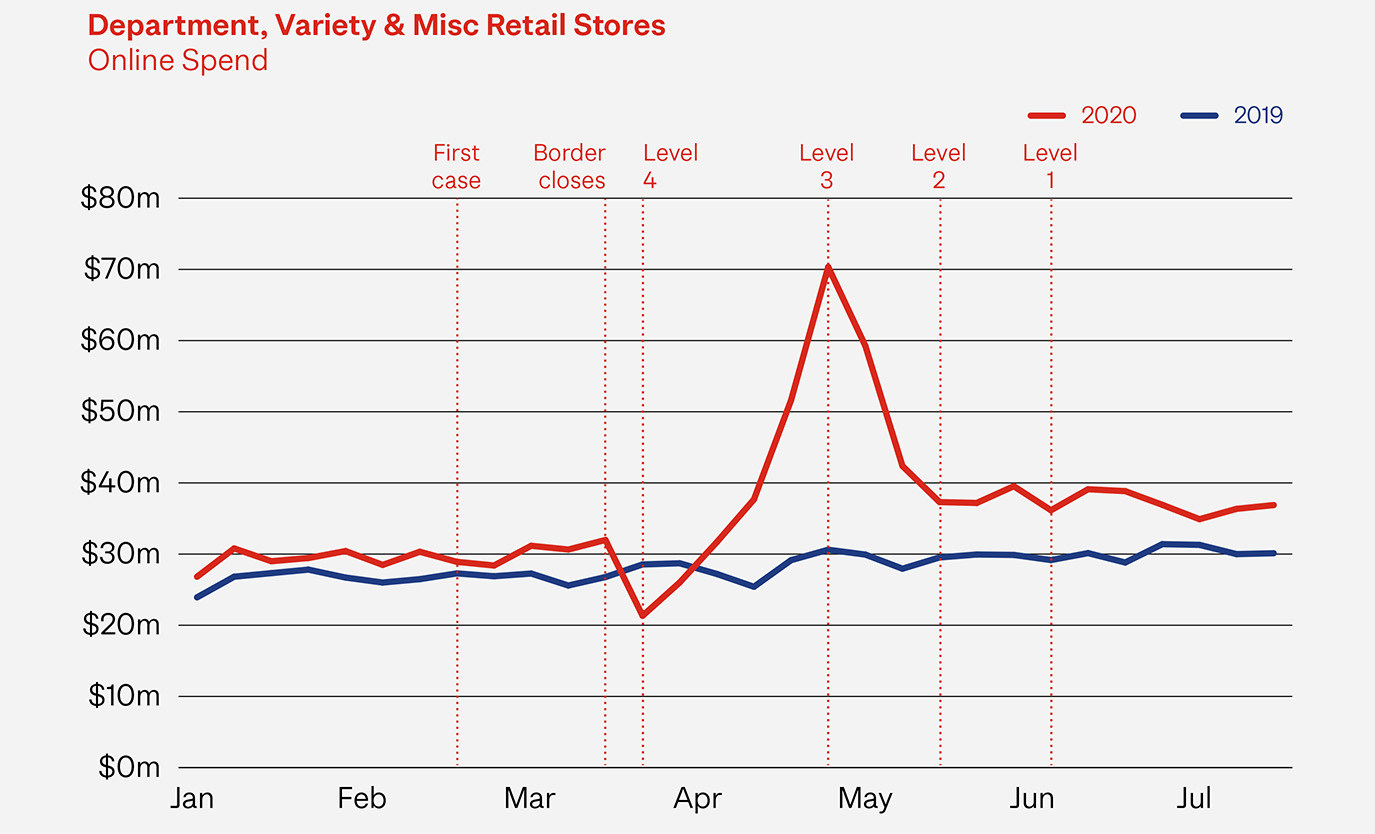
Sector size – $600m (18%)
Spend – up 20%
Transactions – up 13%
Basket size – up 6%
New customers – 261,729
50% of new customers are aged between 40-65.
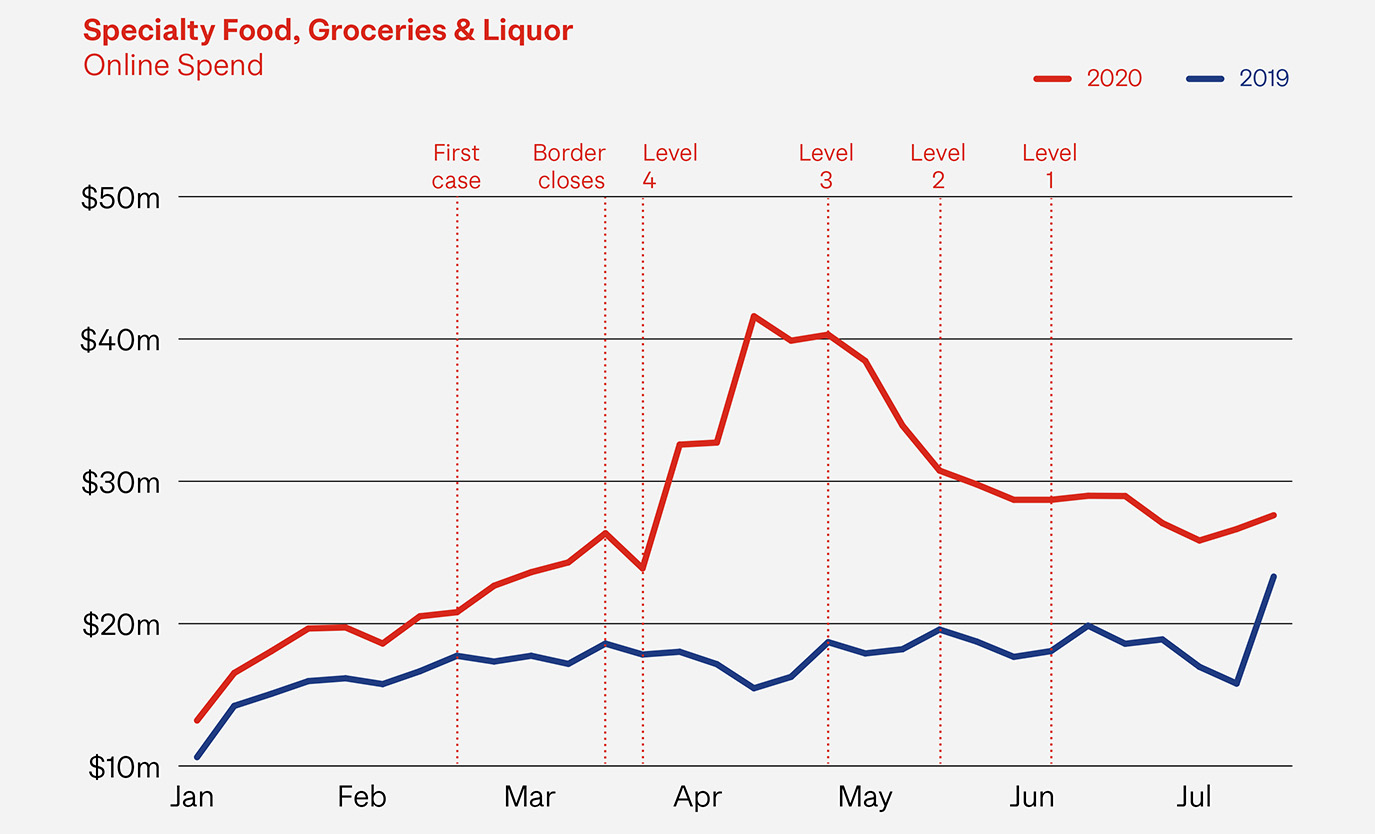
Sector size - $967m (30%)
Spend – up 26%
Transactions – up 19%
Basket size – up 5%
New customers – 263,740
Taranaki, Northland and Gisborne had the highest growth for this sector at 51%, 46% and 41% respectively.
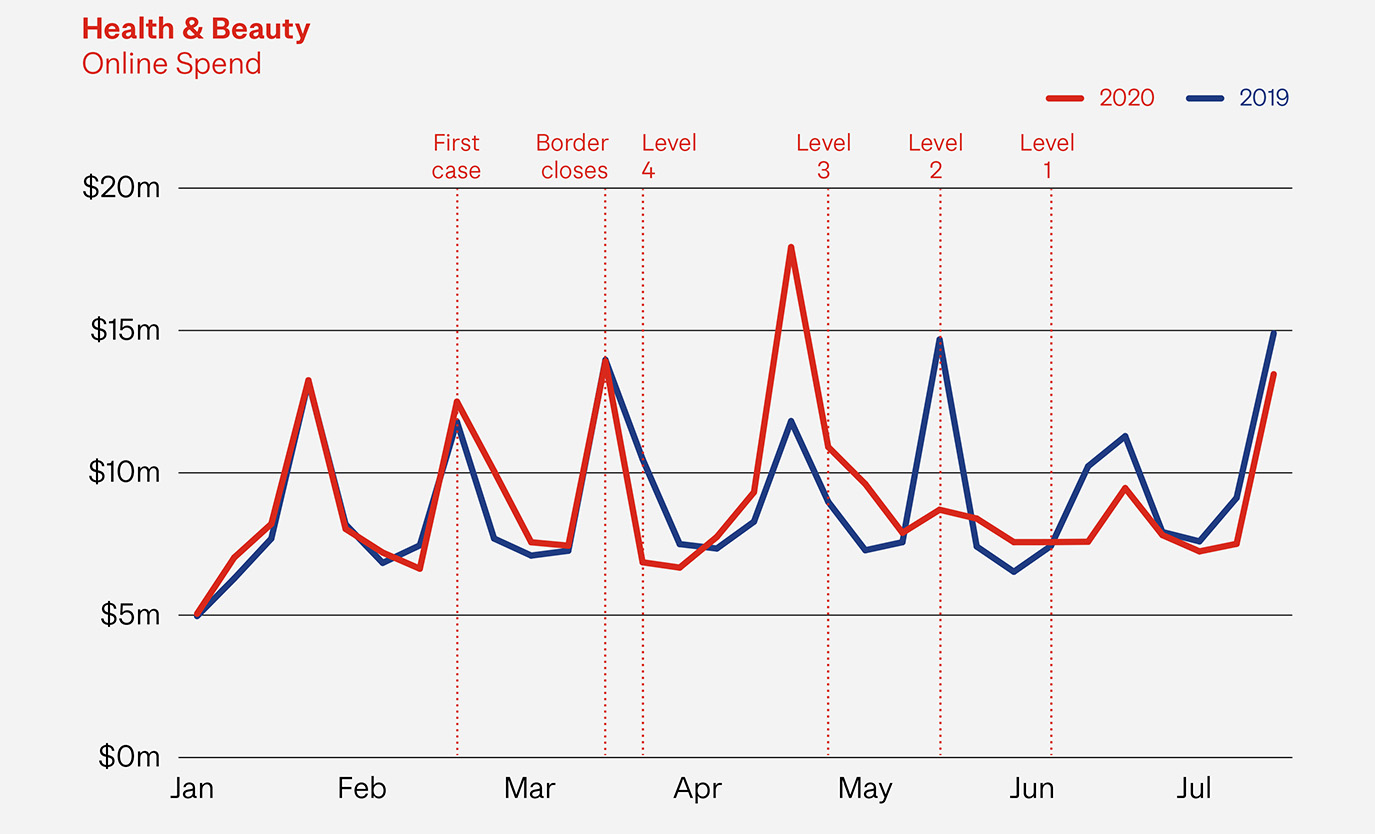
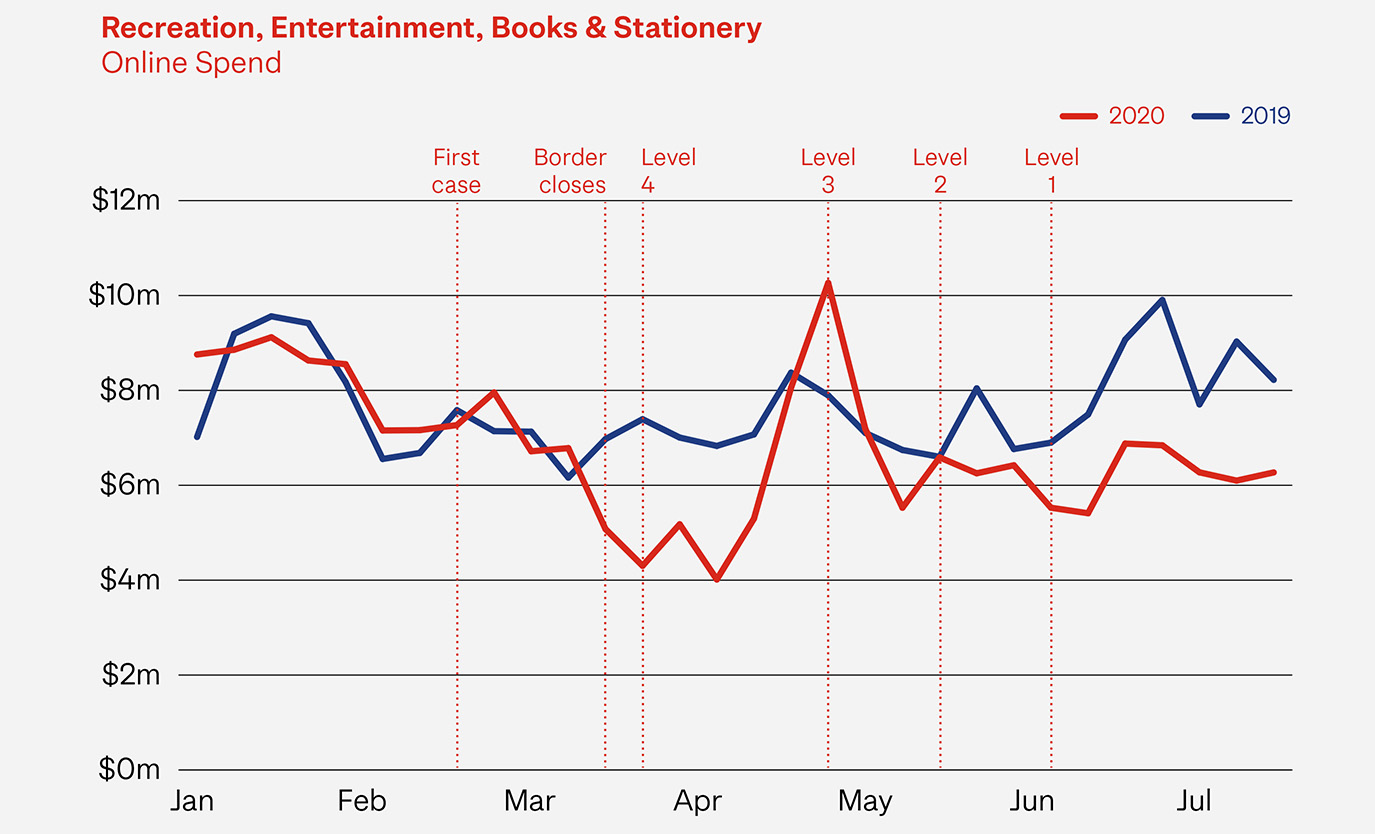
Sector size - $248m (8%)
Spend – down 0.3 %
Transactions – up 3%
Basket size – down 4%
New customers – 238,885
While overall online spend in this sector is declining in 2020, local spend is up 9%.
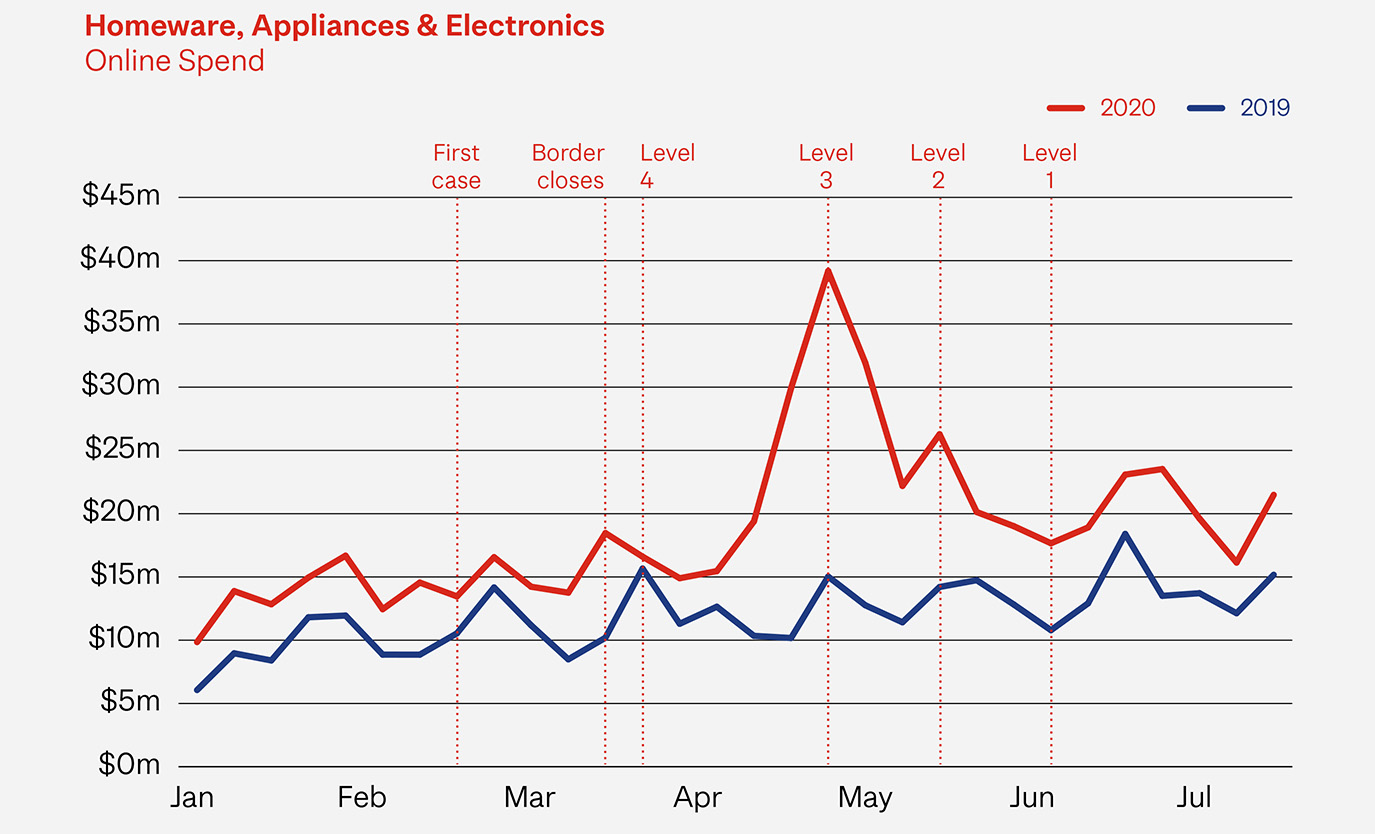
Sector size - $506m (16%)
Spend – up 58%
Transactions – up 60%
Basket size – down 1%
New customers – 377,807
This sector has gained the most new customers over 2020 including almost 97,000 new customers in May.
Sector size - $180m (6%)
Spend – down 14 %
Transactions – down 8%
Basket size – down 7%
New customers – 255,928
While overall online spend in this sector is declining in 2020, spend with local retailers is up 7%.
Sector size - $749m (23%)
Spend – up 55%
Transactions – up 42%
Basket size – up 10%
New customers – 364,512
Sunday has become the most popular day for shopping in this sector, making up more than 25% of spend. This was only 10% pre-COVID-19.