

Online shoppers spent $1.73 billion in October to December 2024 (Q4 2024), up 9% on the same quarter in 2023.
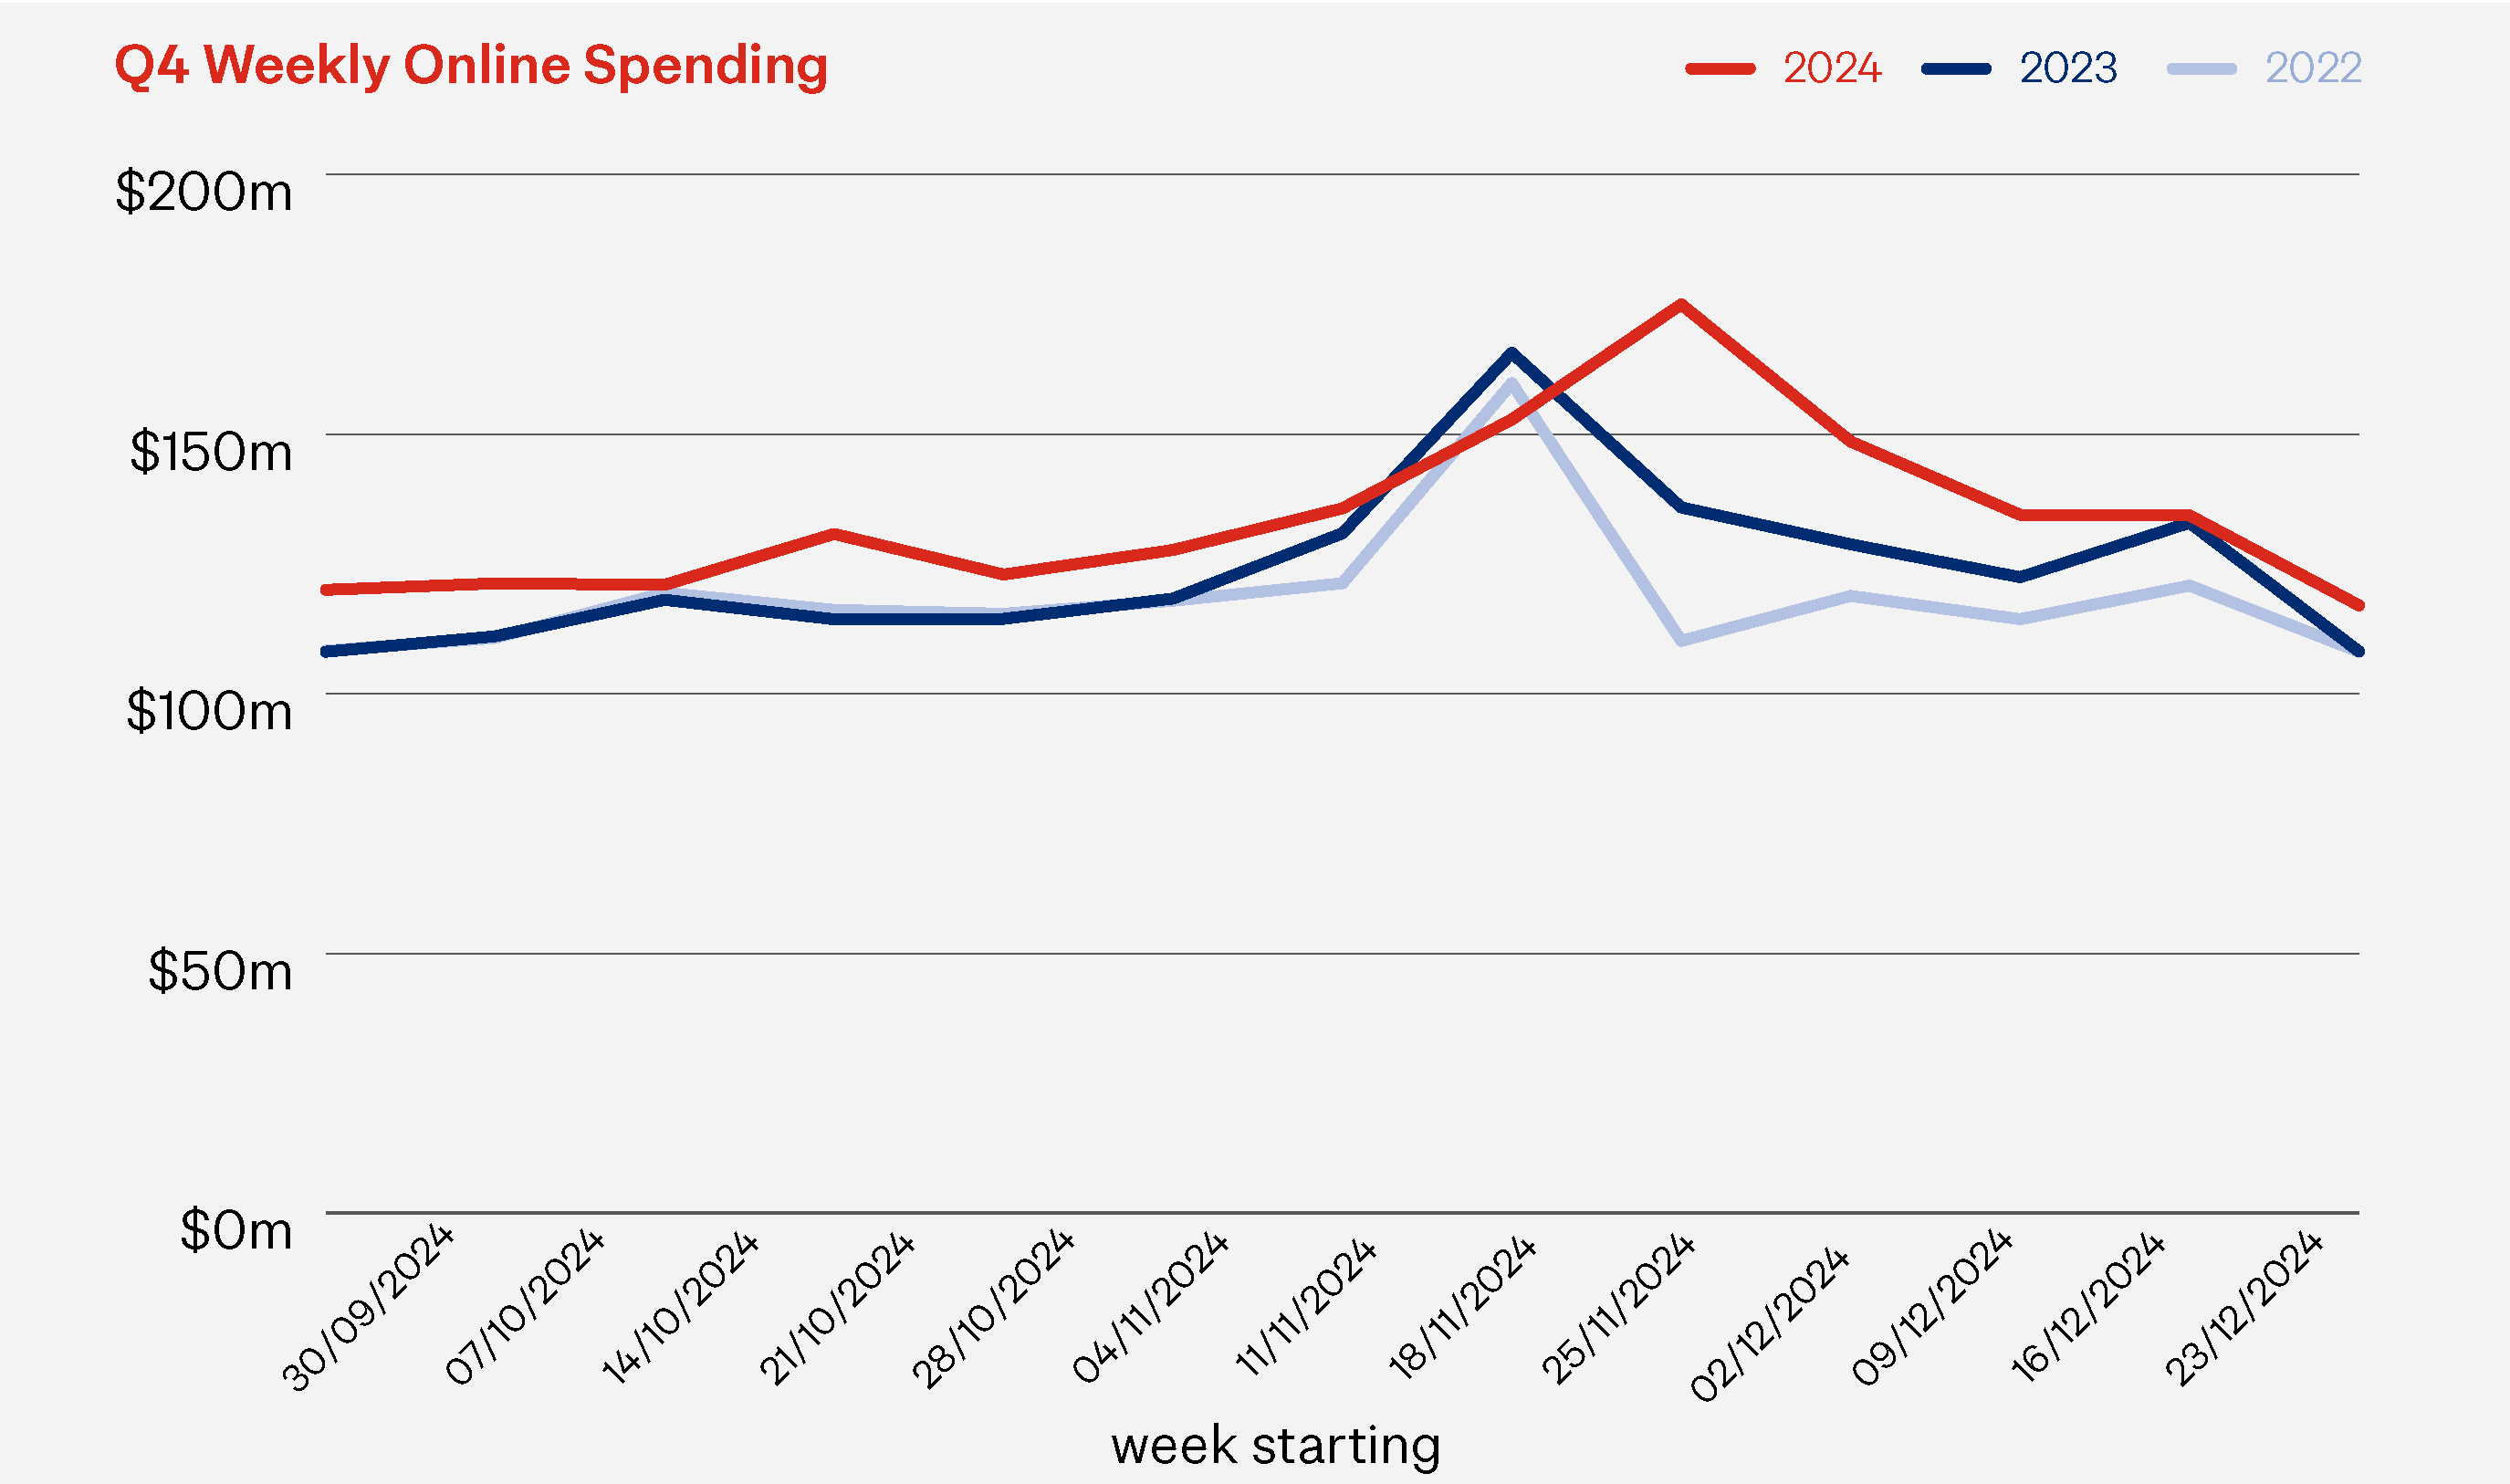
As usual, Q4 was the biggest online spending quarter for the year as Kiwis ramped up their spending from late October, through the November sales, and into Christmas. The quarter’s spending peak was not only higher than last year, but held up longer, adding significantly to the quarter’s strong performance compared to the previous year.
While there appears to be some easing of economic pressures, shoppers continue to be cautious in their spending. As we saw throughout 2024, shoppers made their money go further in Q4 by buying more often, while spending less each time. The result was over 2 million more online transactions (14%) during this quarter than Q4 2023, making this the highest quarterly level of transactions we’ve seen in the last six years.
The underlying spending trends mirror this positive top line result, giving online retailers a compelling reason to feel more optimistic. Q4 2024 saw online spending grow across all sectors and in all regions around the country. Just as importantly, domestic online spending held up strongly to make up 72% of the quarter’s total online spend.
In contrast to online’s positive performance, instore spending for the quarter was flat. A 1% increase in the number of instore transactions was offset by a 1% decline in the instore average basket size (average spend per instore transaction). While instore still dominates how Kiwis shop, we’re seeing online spending continue to grow, making up 11% of total retail spend for the quarter. This continues the trend we’ve been seeing all year of shoppers moving online.
Q4 2024 vs Q4 2023
Online Spending $1.73b▲ 9% | Instore Spending $14.4b0% | Total Retail Spending $16.1b▲ 1% |
The drivers of Q4 2024 spending
Three key factors drive online spending – how many people are shopping online; how often they spend; and how much they spend each time. Q4 2024 saw a positive shift in two of these factors, as more online shoppers purchased more often but spent a little less on each transaction.
- TRANSACTIONS: The biggest contributor to the quarter’s spending growth was the sharp increase in transactions. There were 18.3 million transactions in Q4 2024, making this the highest number of quarterly online transactions we’ve seen since we started monitoring markets six years ago. For context, there were even more online transactions than those COVID-impacted quarters when most physical stores were closed.
- ONLINE SHOPPERS: More than 1.7 million Kiwis (about 40% of the population aged 15 and over) shopped online during Q4 2024. This was nearly 77,000 (4.6%) more than in Q4 2023, in line with population growth.
- AVERAGE BASKET SIZE: The average spend per online transaction (average basket size) was $95, down $4 (4%) on a year ago.
Higher transaction volumes, but lower average spend each time, suggests that shoppers are making active decisions to put less items in their shopping cart, to choose cheaper alternatives, and/or to buy when items are discounted. This is expected behaviour when the household budget is stretched. Although CPI inflation has fallen back from its peak, rent increases along with rising insurance costs and council rates continue to see squeezed budgets for most shoppers.
The average shopper spent $947 online through Q4 2024, $40 (4%) more than in the same quarter last year. With general CPI inflation at 2.2%* online spending saw real growth, not just shoppers paying more for the same items.
NZ POST’S HELPFUL HINTS
Keep focused on delivering value for money. Despite improving conditions, shoppers are still focused on getting value for money. Help them make their dollar go further by offering bundled product offers, discounts for bulk and repeat purchases, loyalty rewards, as well as payment and delivery options. Building long-term value from clients makes those short-term discounts more valuable for your business as well.
Q4 2024’s key shopping days
Most years we see Q4 online shopping follow a similar pattern, beginning with a steady climb from late October that rises sharply to its peak around Black Friday/Cyber Monday. This is followed by a steady decline towards Christmas. The overall shape in 2024 was not too dissimilar, though the quarter’s peak happened a little later and we saw a much slower decline in spending through December.
Largely this reflects an extended sales period, rather than the series of individual promotional events of previous years. ‘Black Friday’ sales started as early as Labour Weekend and carried through to early December when they became the Christmas sales. The overall effect was to remove some of the urgency traditionally associated with one day sales events. We’ve been seeing this ‘peak sales’ period extend for a number of years now and online retailers should plan for something similar in 2025.
Singles’ Day 2024
Online spending on Singles’ Day 2024 was $20.8 million, up 69% on 2023, driven by a 56% increase in online transactions. One reason for this significant growth may be the day of the week. Singles’ Day 2024 fell on a Monday, while it fell on a Saturday in 2023. Saturdays are typically the lowest spending day of the week, often with around 30-40% less online transactions than a Monday.
Overall total retail spending, online and instore, on Singles’ Day was $153.6 million, down 13% on 2023, driven by a large 20% decrease in instore spending.
Black Friday – Cyber Monday Weekend 2024
Online spending for the Black Friday - Cyber Monday four-day period was $94.6 million, $6.5 million (7%) higher than the year before. This was driven by a 11% increase in online transactions, partly offset by the 3% decline in the average basket size.
Instore spending for the same 4-day period was $734 million, about the same as last year.
Black Friday – Cyber Monday Weekend 2024 (compared to 2023)
Online Spending $94.6m▲ 7% | Online Transactions +11%
| Online Average Basket Size -3%
|
Christmas 2024
Online spending declined after the Black Friday peak and continued to fall steadily through to the end of the year. In Q4 2023, we saw a mini-peak the week before Christmas (including 2023 largest online spend day on 20 December 2023) though this wasn’t evident in 2024.
Instore spending followed a similar pattern, declining throughout December before rising in the week before Christmas, as shoppers rushed to do the last of their Christmas shopping.
Boxing Day 2024
Online spending was $19.4 million on Boxing Day, up 21% on 2023, driven by a 30% increase in online transactions. With nearly 200,000 online transactions in a single day, this is the ‘busiest’ Boxing Day we’ve seen in the six years we’ve been monitoring online spending.
This is the second ‘boomer year’ for Boxing Day online spending, following a 20% increase in 2023’s Boxing Day spending. It’s clear that Kiwis still place value on this annual sales event but more of them are choosing to do it online rather than fight the crowds at the malls.
Boxing Day (compared to 2023)
Online Spending $19.4m▲ 21% | Online Transactions +30%
| Online Average Basket Size -7%
|
Boxing Day instore spending was up 5%, with over $157.6 million spent in a single day. Recovering from its lows in 2022 and 2023, Boxing Day still remains a significant event on a retailer’s calendar.
NZ POST’S HELPFUL HINTS
Reconnect with your customers. Through tough times and the better time ahead, make sure you remain engaged with your customers. As their economic situation improves their shopping patterns will change. Make sure they know what you have to offer and the reasons why they should choose you over other options. Focus on factors that customers value like being local, easy returns, value-pricing, and delivery options.
Q4 2024’s Trends - Sectors
Online spending grew for all sectors compared to Q4 2023.
Clothing & Footwear +17%
| Recreation, Entertainment, +14%
| Homewares, +10%
|
Health & Beauty +7%
| Department, Variety & +5%
| Speciality Food, +4%
|
- Clothing & Footwear had the fastest online spending growth rate (+17%) compared to Q4 2023, driven by 25% more transactions while the average basket size was down 7%.
- Department, Variety & Miscellaneous Retail Stores, the largest online spending sector, saw a 5% increase in spending, driven by increased spending with offshore retailers (+23%) like Temu, Shein and others. Online spending with domestic retailers in this sector however was down 11% on Q4 2023.
- Health & Beauty (+7%), and Speciality Food, Groceries & Liquor (+4%) both saw increased online spending compared to the same quarter in 2024. Suprisingly, both sectors bucked the trend of prioritising essential spending that we’ve seen in the last year. Growth was driven from discretionary subsectors like cosmetics and liquor.
Instore spending was mixed across sectors. Health & Beauty, and Speciality Food, Groceries & Liquor both saw modest growth in instore spending. Spending at Department, Variety & Miscellaneous Retail Stores was flat, while all other instore sectors saw spending decline compared to Q4 2023.
Q4 2024’s Trends - Regions
Online spending grew in all regions, but growth rates varied.
- Taranaki had the fastest growth rate of 35% compared to Q4 2023, followed by Nelson (+24%) and Tasman (+18%).
- Wellington had the slowest growth rate of 4%, equal with Gisborne. Wellington spending is thought to have been impacted by widespread public service job cuts.
- Auckland’s growth rate was 6%, one of the lower growth rates of all the regions. Auckland’s spending made up 34% of the country’s online spending in Q4 2024.
Instore spending saw Auckland and Taranaki down 1% on Q4 2023, while all other regions were unchanged or up a modest 1 to 2%.
NZ POST’S HELPFUL HINTS
Keep up to date on the latest data and trends. See how Q4 contributed to the key numbers and trends in 2024 in our review of 2024 Online Spending Data and Trends. Coming soon.
How we can help
We’re passionate about helping you grow your online business, through peak and beyond. Talk to us about what you need and how we can best deliver it for you. https://www.nzpostbusinessiq.co.nz/how-we-can-help
* https://www.stats.govt.nz/news/annual-inflation-at-2-2-percent-in-december-2024/
The data used in this eCommerce Spotlight is card transactional data supplied by Datamine. We are continually reviewing and refining our methodology to bring our readers the most relevant and accurate information possible. At times, as we update our approach, this creates some discrepancies with previously published information. While we don’t go back and adjust earlier published information, when comparing current information with past periods we use consistent like-for-like methodology.