

It won’t surprise anyone that Q4 2021 was the biggest online spending quarter since we started monitoring online spend four years ago. New Zealanders spent a massive $2.5 billion online this quarter. That’s 45% higher than the same quarter last year - an additional $772 million of online spend - and up over a billion dollars (71%) on two years ago.
To further highlight just how big the quarter was, a third of the year’s online spend happened in just the last three months of 2021.
In comparison, spending within physical stores fell by 3% for the quarter compared to Q4 2020. Undoubtably this was driven by lockdowns, especially in Auckland which saw the retail sector only able to operate from early December. Even then it was with restrictions, and with a level of shopper nervousness, that impacted instore numbers and the shopping experience.
Overall spending, online and off, for the quarter was up 2% on Q4 2020 with online making up 14%. So, while going to the stores is still the main way Kiwis like to shop, online continues to grow rapidly, up from 10% of total retail spend for the same quarter in 2020 and 9% in 2019.
More good news for retailers based here with 74% of the quarter’s online spend local, continuing the sentiment we’ve seen in the last two years to support domestic businesses. Undoubtably, this was heightened by the increased uncertainty around international parcel deliveries.
The drivers of growth
In each edition of eCommerce Spotlight, we look at the key factors that drive online spending – the number of shoppers online, how often they shop and how much they spend each time. This quarter’s shopping drivers continue a number of key trends we’ve seen emerging throughout 2021.
Quarterly online customers
1.9mQ4 2021 |
1.8mQ4 2020 |
1.7mQ4 2019 |
The total number of customers online increased by 9% compared to Q4 2020, with 46% of the adult population of New Zealand shopping online during the quarter. While most of this growth reflects returning online shoppers, lockdown restrictions and safety concerns continued to drive a steady stream of first time shoppers. This quarter there were nearly 74,000 first time online shoppers.
Quarterly online transactions
22.5mQ4 2021 |
15.3mQ4 2020 |
14.0mQ4 2019 |
The quarter’s biggest spend driver was undoubtably transaction growth. There were over 22.5 million transactions online this quarter. That averages out to nearly 245,000 online transactions per day, a level that outstrips any previous transaction levels we’ve seen. Compared to the same quarter last year, we had 7.2 million more transactions in the quarter, a massive increase of 47%.
Quarterly online basket size
$111Q4 2021 |
$113Q4 2020 |
$104Q4 2019 |
And while shoppers are transacting more often, the average amount they spend online each time has seen a small drop. The average online transaction in Q4 2021 was just over $111, down on the same quarter last year but still well up on pre-pandemic days.
Even though the average shoppers’ basket size is down, the frequency by which they shop has moved significantly in the other direction. With an average of 11.7 transactions per customer this quarter, it now means that the average shopper buys online nearly once every week.
Quarterly transactions per customer
11.7Q4 2021 |
8.7Q4 2020 |
8.4Q4 2019 |
Combined, the lower average basket size is more than offset by the increase in shopping frequency resulting in a significant upward shift in average quarterly spend per customer. The average customer spent $1,302 in Q4 2021, 33% more than they spent in Q4 2020 and nearly 50% more than they did in pre-pandemic days (Q4 2019).
Average quarterly spend per customer
$1,302Q4 2021 |
$981Q4 2020 |
$872Q4 2019 |
In short, while the quarter’s growth was driven to a degree by more online shoppers, the most important driver was that shoppers transacted more often, even though it was at slightly lower levels of spend. This would suggest that shopping online has become a habit across more people and also a wider range of everyday purchase activities.
Sales events, Christmas and beyond
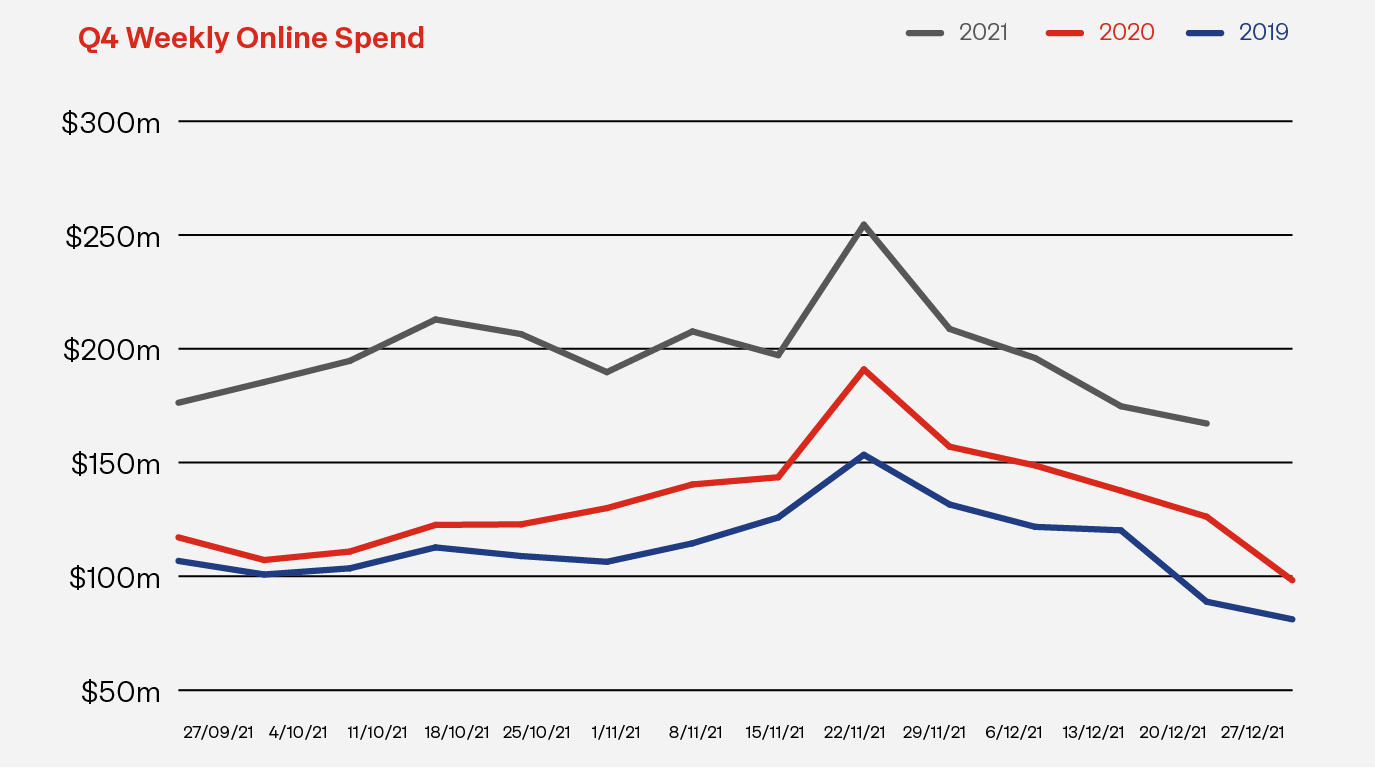
Q4 is certainly peak season for retailers as they ramp up their sales activity leading into Christmas. Traditionally, the sales start from late October and continue through the big event days - Singles’ Day (11/11), Black Friday (26/11), and Cyber Monday (29/11) – through to Christmas and Boxing Day.
Sales events days online spend (compared to the same day 2020)
$30.8mSingles' Day |
$39.8mBlack Friday |
$39.5mCyber Monday |
In recent years, we’ve seen November’s sales events become more than a one-day thing with promotions starting progressively earlier and lasting longer. This trend was clearly present this year with many businesses seemingly offering continuous deals throughout the month. As a result, we saw the big sales highs on days other than the designated event days. Singles' Day, for example, peaked before the big day, partly driven by early promotional activity and also by the launch in New Zealand of Click Frenzy, a popular Australian online sales event. Black Friday spending peaked on the Wednesday before Black Friday, leading some commentators to refer to this week as ‘Black Week.’
The summit of November’s big spending period has historically been the four-day weekend which spans Black Friday to Cyber Monday. And while this wasn’t the peak this year, online spending exceeded $141.3 million, up 23% compared to the same four days in 2020 and up 60% on 2019.
The big spending numbers continued into December. The month as a whole saw online spending of $760 million, up 28% on December 2020 and a huge 50% up on December 2019. Total spending, online and offline, for the month, was $6.7 billion, up 5% from 2020. This was good news for physical retailers, especially in Auckland, with national daily instore spending peaking at close to $300 million just before Christmas.
With an extended period of high spending, it was feared that Boxing Day may not live up to its reputation for driving a shopping frenzy. There was no need to fear with nearly $195 million spent on Boxing Day across both online and off. That was just 3% lower than in 2020. Online growth was more spectacular, 29% up on Boxing Day 2020, driven by nearly 184,000 online transactions for the day. Like the earlier sales events, Boxing Day promotions seemed to start much earlier and extend well beyond the day and into the new year, allowing retailers to finish the year strongly.
The quarter’s other key trends
Regional online spending
- Given the ongoing impact of lockdowns and restrictions, Auckland showed the strongest growth in online spending, up 63% compared with Q4 2020, and up 94% compared with pre-Covid Q4 2019. Aucklanders’ online spending of $1.09 billion made up 44% of the national online spend.
- Two other regions that experienced lockdowns and restrictions during the quarter, Waikato and Northland, rounded out the top three strongest growing regions, with online spending up 43% and 42% respectively compared to Q4 2020.
- All regions experienced strong growth, above 25%, compared to Q4 2020.
What online shoppers purchased
- Kiwis bought more of everything online in Q4 2021, with all sectors experiencing growth of over 25% compared to the same quarter in 2020.
- The sectors with the strongest growth were: Clothing and Footwear (up 70%), Department, Variety & Misc. Retail (up 67%), and Homewares, Appliances & Electronics (up 64%).
- And Buy Now, Pay Later continued its phenomenal run over the last few years, with increased spend of 53% compared to Q4 2020 and more than double compared to Q4 2019.
Who’s buying online?
- While the 30–60-year-old age group still dominates online spending numbers, the 15–29-year age group grew the most this quarter, up 49% on Q4 last year and 81% on Q4 2019.
The data used in this eCommerce Spotlight is card transactional data supplied by Datamine. We are continually reviewing and refining our methodology to bring our readers the most relevant and accurate information possible. At times, as we update our approach, this creates some discrepancies with previously published information. While we don’t go back and adjust earlier published information, when comparing current information with past periods we use consistent like-for-like methodology.